
Vue - Chart.js를 이용한 반응형 데이터 시각화
프론트엔드 연습용으로 간단하게 더미 데이터를 만들어 테스트 해보려고 만든 저장소입니다.
프론트엔드를 다루는게 처음이라 혹시 틀린점이나 프론트엔드 고수형님 계시면 피드백 부탁드립니다..😭
사용 기술 스택
Backend
- Spring Batch (아직 사용 안함)
- Spring Data JPA
- Maria DB
- QueryDSL (아직 사용 안함)
- MQTT, RTSP, HLS, FFmpeg (아직 사용 안함)
- Akka Actor (Scala)
- Kakao Map API (아직 사용 안함)
Frontend
- Vue 3 Composition API, BootStrap, Vite
- Axios, Chart.js, Vue-Chart-3, ESLint, hls.js, moment, date-fns
- Vuex
- Vue Router
- date-fns & @types/date-fns
요구 사항
- 딥러닝 엔진에서 특정 트리거가 발동되면 이벤트 데이터가 나온다. (Json, CSV, RTSP, 영상 데이터 등등)
- Spring Batch Job, Akka Actor 를 이용하여 주기적으로 MQTT를 이용해 백엔드로 주기적 전송/파싱 -> DB 저장
- Frontend로 넘길 Rest API 작성
- Frontend에서 Rest API로 데이터를 떙겨와 Time Graph에 데이터를 넘긴다.
- 감시자(Watcher)가 Rest API에서 데이터를 가져오는 함수를 감시하며 새로운 데이터가 Fetch 될 시 차트의 데이터 업데이트
- 데이터를 넘기면서 Reactive하게 실시간으로 차트의 x,y축이 변동되고 바로 적용되어야 함
간단한 Backend Parsing Logic 구현
간단한 더미 데이터(CSV) 파싱을 위한 Parser를 작성하였습니다.
DTO, Service, Repository, Entity 들도 작성했으나 글에선 건너뜁니다.
지금은 단순하게 로컬의 파일을 읽어 파싱 후 Rest API로 내보낼 뿐이지만, 나중에 Spring Batch를 사용하여 주기적으로 데이터를 변환해보겠습니다.
@Component
@RequiredArgsConstructor
public class Parser {
    private final FrameRepository frameRepository;
    private final Logger log = LoggerFactory.getLogger(Parser.class);

    /**
     * 변환, 리스트 저장 실패 시 트랜잭션 롤백
     */
    @PostConstruct
    @Transactional
    public void initData() {
        // 임시로 로컬에서 CSV를 읽어옴
        Resource resource = new ClassPathResource("sample/test.csv");

        try {
            List<String> lines = Files.readAllLines(Paths.get(resource.getFile().getPath()), StandardCharsets.UTF_8);
            List<Frame> list = new ArrayList<>();

            // CSV의 첫 행은 헤더이기 때문에 0번쨰 인덱스 스킵
            for (int i=1; i<lines.size(); i++) {
                String[] split = lines.get(i).split(",");

                // CSV 파일의 값중 String이 아닌 값들의 타입 변환 준비
                int count;
                float frameTime;
                long systemTimestamp;
                LocalDateTime systemDate;
                DateTimeFormatter dateFormat = DateTimeFormatter.ofPattern("EEE MMM dd HH:mm:ss yyyy", Locale.ENGLISH);
                String dateString = split[4];

                try {
                    // Count 변환
                    count = Integer.parseInt(split[0]);

                    // Frame Time 변환
                    Float frameValue = Float.parseFloat(split[2]);
                    frameTime = Float.parseFloat((String.format("%.4f", frameValue))); // 소수점 4자리 까지만

                    // System TimeStamp 변환
                    systemTimestamp = Long.parseLong(split[5]);

                    // System Date 날짜 변환
                    systemDate = LocalDateTime.parse(dateString, dateFormat);
                } catch (Exception e) {
                    log.error("CSV 데이터 변환 실패");
                    throw new CommonException("DATA-003", HttpStatus.BAD_REQUEST);
                }

                // Entity 생성
                Frame frame = Frame.createOf(
                        count,
                        frameTime,
                        split[3],
                        systemDate,
                        systemTimestamp
                );

                list.add(frame);
            }

            // 리스트에 Entity 추가
            try {
                frameRepository.saveAll(list);
            } catch (Exception e) {
                log.error("Entity List 저장 실패");
                throw new CommonException("DATA-002", HttpStatus.BAD_REQUEST);
            }

        } catch (IOException e) {
            log.error("데이터 파싱 실패");
            throw new CommonException("DATA-001", HttpStatus.BAD_REQUEST);
        }
    }
}
Scatter/Line Chart 구현해보기
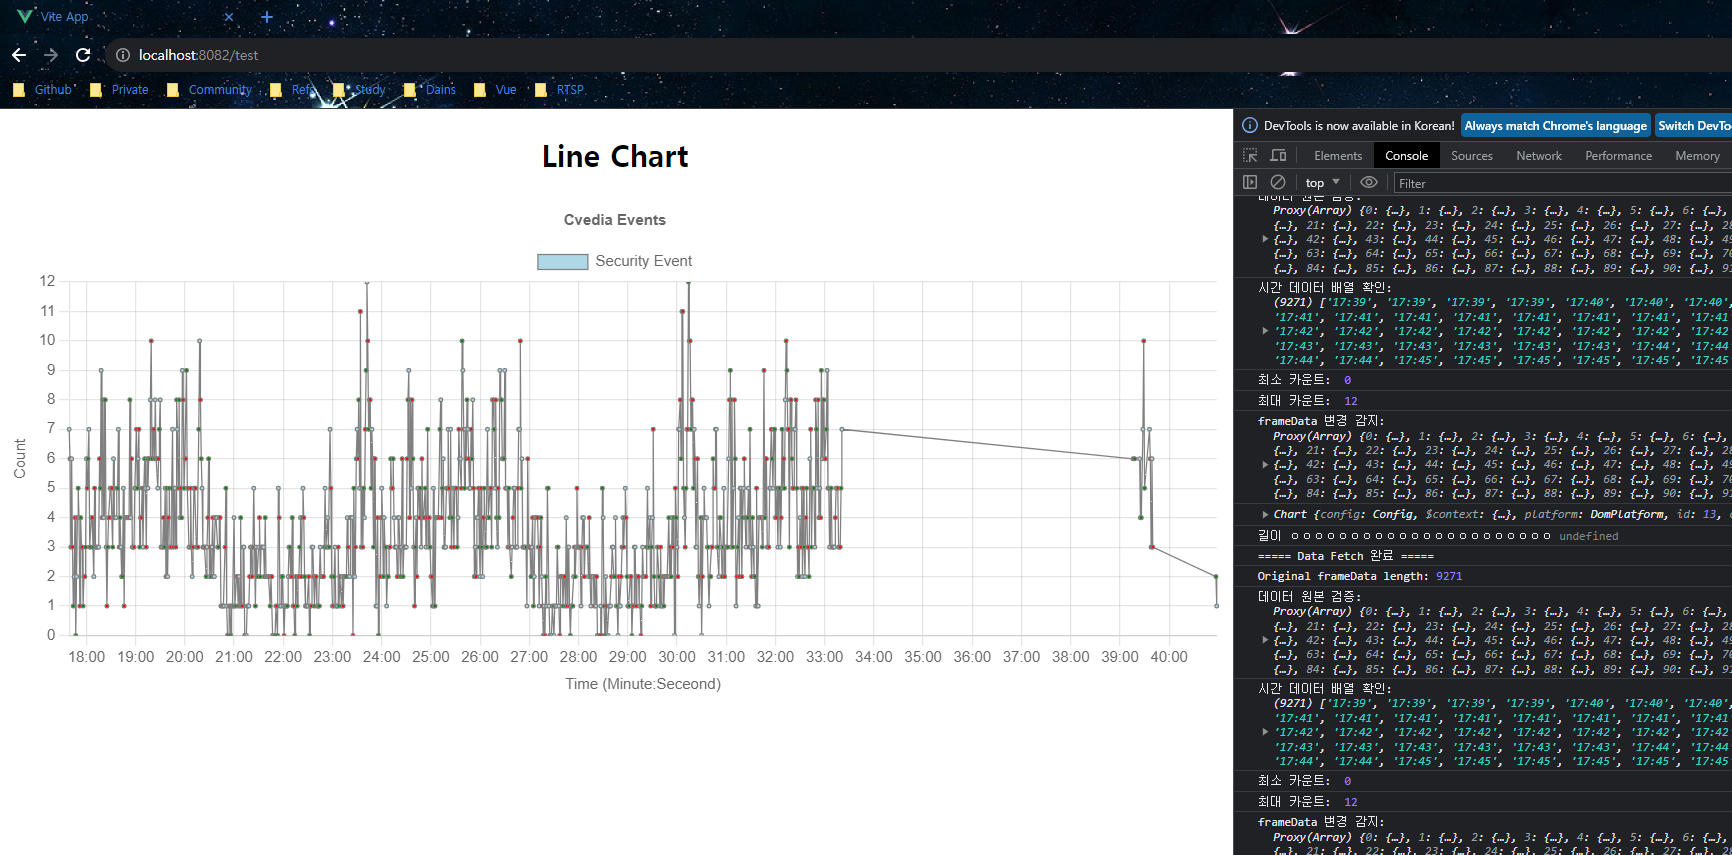
☆ Scatter Chart를 쓰다가 선을 그리기 위해 Line Chart로 변경했습니다. ★
아래는 구현한 차트 컴포넌트의 전체 코드입니다.
Template
v-if를 통해 차트가 렌더링 되기 전 데이터가 들어오지 않는다면 차트를 렌더링 하지 않게 설정합니다.
onBeforeMount Lifecycle Hook을 사용해도 되지만 간단하게 v-if를 사용하였습니다.
<!-- Chart Instance 접근 방법 = scatterRef.value?.chartInstance.toBase64Image(); -->
<template>
  <div>
    <h2 align="center">Scatter Chart</h2>
    <div style="overflow: auto; max-width: 1000px; max-height: 800px;">
      <LineChart
v-if="frameData && frameData.length"
ref="scatterRef" :chartData="chartData"
:options="chartOptions"
@chart:render="handleChartRender" />
    </div>
  </div>
</template>
TimeGraph.vue
초기화 및 세팅:
- 반응성을 가진 변수와 인터페이스를 설정,
frameData는 가져올 데이터를 저장할 변수로 초기화
- 반응성을 가진 변수와 인터페이스를 설정,
라이프 사이클 훅 및 이벤트 핸들러:
onMounted훅에서 페이지가 마운트되었을 때setData함수를 호출하여 백엔드 데이터 FetchhandleChartRender함수에서는 차트가 렌더링될 때마다 콘솔에 차트의 정보를 출력
데이터 가져오기 및 처리:
setData함수에서 API를 호출하여 데이터를 가져와frameData에 저장, 가져온 데이터에 대한 몇 가지 정보를 콘솔에 출력groupBy함수를 사용하여systemDate기준으로 데이터를 그룹화, 각 그룹의 최대count값을 배열로 반환하는 로직 구현maxCount와minCount는 그룹화된 데이터의 최대, 최소 count 값 계산
차트 데이터 및 옵션 설정:
chartData는frameData를 기반으로 차트에 표시될 데이터 포맷 설정x값은 시간과 분을 문자열로 반환하고,y값은 계산된 최대 count 값을 사용chartOptions는 차트의 다양한 옵션(툴팁, 제목, 범례, 스케일 등) 설정
감시자 (Watcher):
frameData의 값이 변경될 때마다 감지하고, 데이터의 길이가 0보다 큰 경우에scatterRef를 참조하여 차트를 업데이트
<script lang="ts" setup>
import { ref, computed, onMounted, watch } from 'vue';
import { LineChart } from 'vue-chart-3';
import { Chart, registerables } from "chart.js";
import { fetchFrame } from "@/stores/api";
import { groupBy } from 'lodash';

Chart.register(...registerables);

/* ===== Reactive 변수 ===== */
interface FrameData {count: number;frameId: number;frameTime: number;instanceId: string;systemDate: number[];systemTimestamp: number;}
const scatterRef = ref<InstanceType<typeof ScatterChart> | null>(null);
const frameData = ref<FrameData[]>([]);

/* ===== Life Cycle Hooks ===== */
onMounted(() => {
  setData();
});

/* ===== Render Events ===== */
function handleChartRender(chart: any) {
  console.log(chart);
}

/* ===== Rest API에서 데이터 받아오기 ===== */const setData = async () => {
  console.log("===== Data Fetch 완료 =====")

  try {
    frameData.value = await fetchFrame();
    console.log("Original frameData length:", frameData.value.length);
    console.log("데이터 원본 검증: ", frameData.value);
    console.log("시간 데이터 배열 확인: ", frameData.value.map(frame => getMinutesFromSystemDate(frame.systemDate)));
    console.log("최소 카운트: ", minCount.value);
    console.log("최대 카운트: ", maxCount.value);
  } catch (error) {
    console.error('데이터를 가져오는 중 오류 발생:', error);
  }
};

/* ===== Fetch된 데이터를 동일한 값의 systemDate를 기준으로 systemDate의 문자열 기준 Grouping ===== */
const groupedByKey = computed(() => groupBy(frameData.value, frame => getMinutesFromSystemDate(frame.systemDate)));
console.log('길이 ㅇㅇㅇㅇㅇㅇㅇㅇㅇㅇㅇㅇㅇㅇㅇㅇㅇㅇㅇㅇㅇㅇ', groupedByKey.value.length)

/* ===== 각각의 그룹화된 그룹에서 최대 count 값을 반환하는 배열을 생성 ===== */
const maxCounts = computed(() => {
  return Object.values(groupedByKey.value).map(groupedFrames => {
    return groupedFrames.reduce((max, currentFrame) => {
      return currentFrame.count > max.count ? currentFrame : max;
    }).count;
  });
});

/* ===== Computed ===== */
const maxCount = computed(() => Math.max(...maxCounts.value));
const minCount = computed(() => Math.min(...maxCounts.value));

/* ===== 시간과 분을 문자열 형태로 반환 ===== */
const getMinutesFromSystemDate = (systemDate: number[]): string => {
  const [, , , , minute, second] = systemDate;
  return `${String(minute).padStart(2, '0')}:${String(second).padStart(2, '0')}`;
};

/* ===== Chart Data =====
 * x값 : groupedByKey의 키(시간 문자열)을 돌면서 최대 Count값을 찾아서 x에 할당
 * y값 : 각 그룹의 최대 Count 수
 */
 const chartData = computed(() => {
  const dataPoints = Object.keys(groupedByKey.value).map((timeKey) => {
    const framesForThisTime = groupedByKey.value[timeKey];
    const maxCountForThisTime = framesForThisTime.reduce((max, currentFrame) => {
      return currentFrame.count > max.count ? currentFrame : max;
    }).count;

    return {
      x: timeKey,
      y: maxCountForThisTime,
      frameId: framesForThisTime[0].frameId
    };
  });

  return {
    datasets: [
      {
        label: "Security Event",
        data: dataPoints,
        backgroundColor: ['lightblue', 'red', 'green'],
        pointRadius: 1.5, // 점의 반지름 옵션
        showLine: true, // 선을 그리는 옵션
        borderColor: 'gray', // 선의 색깔
        borderWidth: 1 // 선의 굵기
      },
    ],
  };
});

/* ===== Chart Options ===== */
const chartOptions = ref({
  responsive: true,
  maintainAspectRatio: false, // 차트의 비율을 고정하지 않음
  aspectRatio: 1, // 비율을 1:1로 설정
  plugins: {
    tooltips: {
      callbacks: {
        title: function() {
          return 'Frame ID';
        },
        label: function(tooltipItem, data) {
          const dataIndex = tooltipItem.index;
          if (typeof dataIndex !== 'undefined') {
            const frameId = data.datasets[tooltipItem.datasetIndex].data[dataIndex].frameId;
            return `Frame ID: ${frameId}`;
          }
          return '';
        }
      }
    },
    legend: {
      position: 'top',
    },

    title: {
      display: true,
      text: 'Cvedia Events',
    },
  },
  // Time Scales
  scales: {
    // x축 System Date 시간 포맷 설정
    x: {
      type: 'time',
      title: {
        display: true,
        text: 'Time (Minute:Seceond)'
      },
      time: {
        unit: 'minute',
        displayFormats: {
          minute: 'mm:ss'
        },
        parser: 'mm:ss'
      },
      ticks: {
        source: 'auto'
      }
    },
    // y축 Count 포맷 설정
    y: {
      title: {
        display: true,
        text: 'Count'
      },
      min: minCount,
      max: maxCount,
      ticks: {
        stepSize: 1,
        beginAtZero: true
      }
    }
  }
});

/* ===== Watcher ===== */
watch(frameData, (newData) => {
  console.log('frameData 변경 감지: ', newData);
  if (newData.length > 0) {
    scatterRef.value?.update();
  }
});
</script>
Scatter Chart
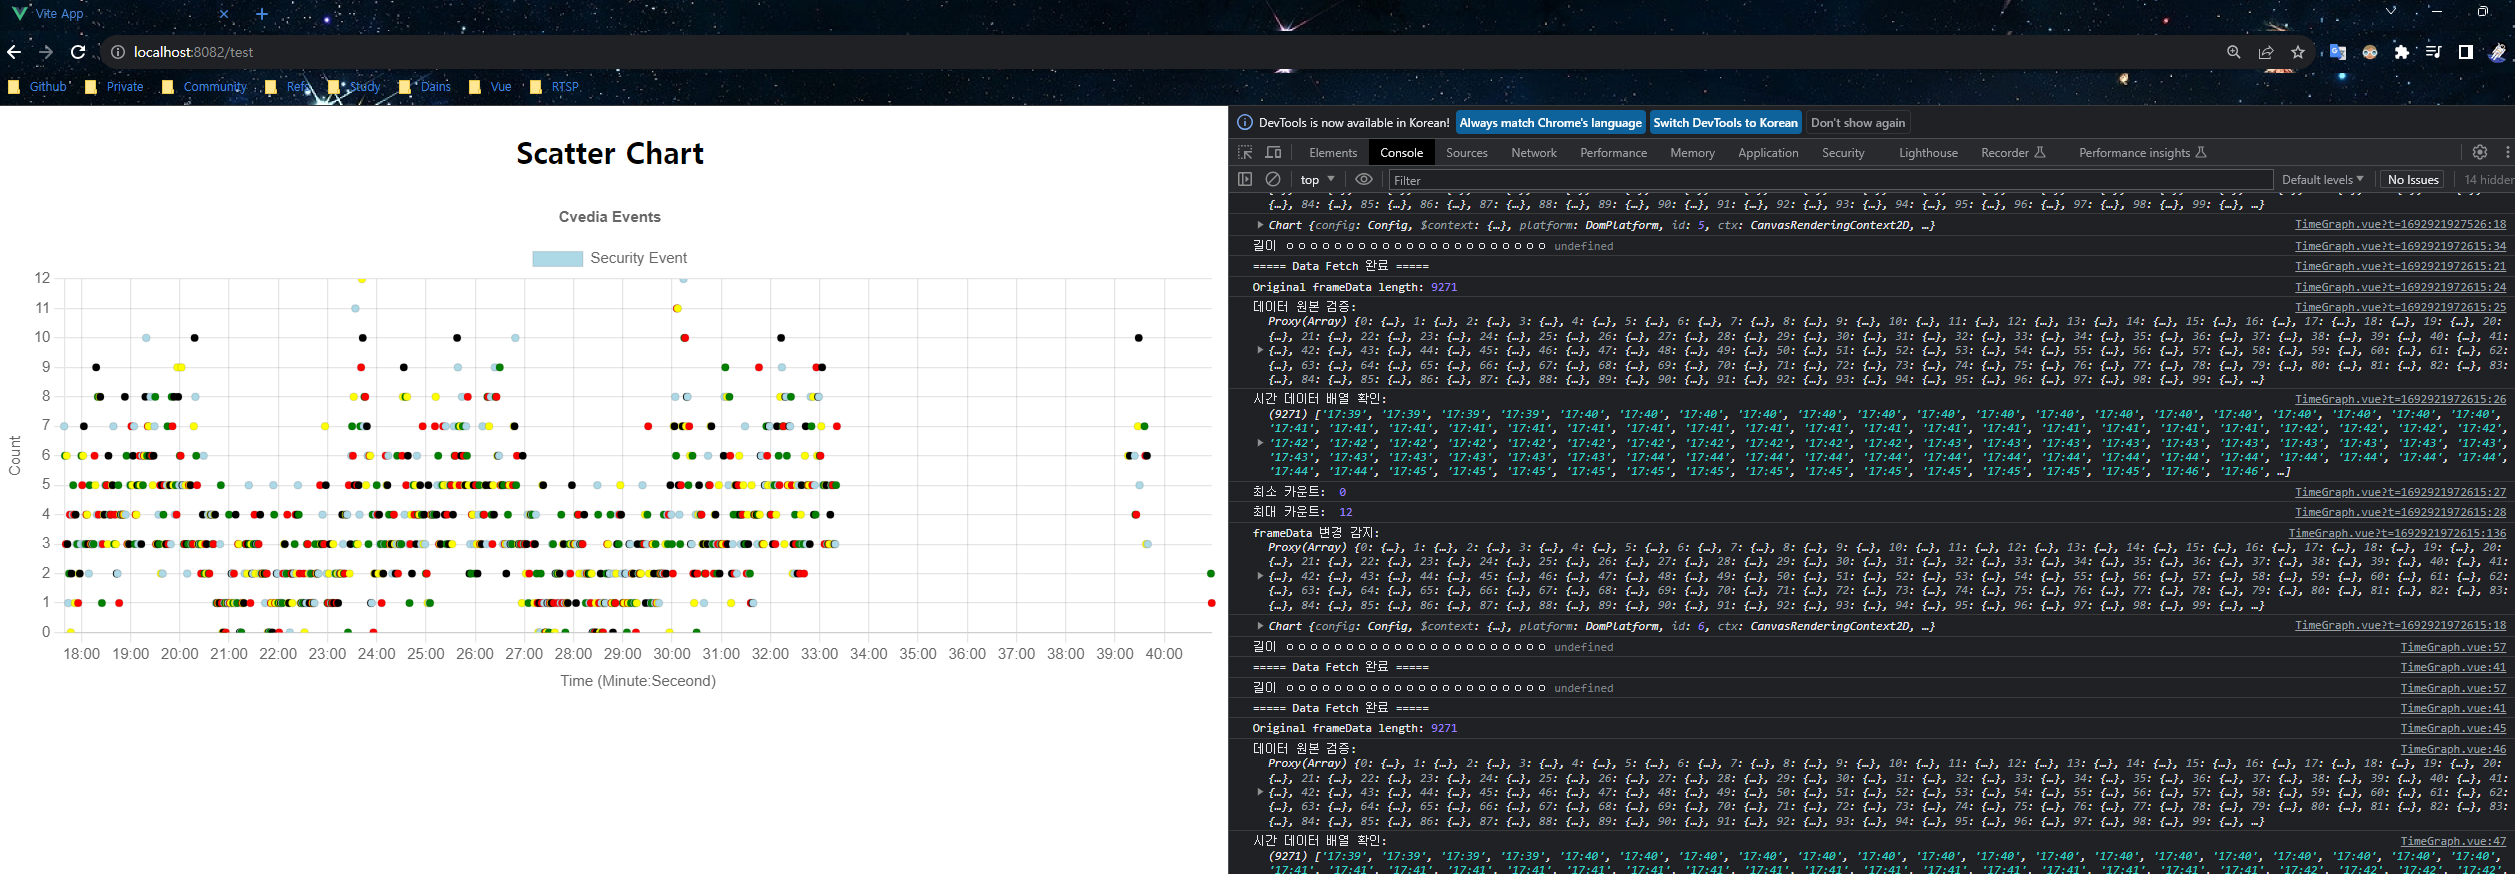
선을 그리기 위해 Line Chart로 변경
😲 시간 데이터를 다루다가 뭔가 자꾸 이상한 값으로 변하길래 알아보다가 발견한 아주 좋은 글
내용 추가 중..
Spring Batch를 이용한 주기적인 이벤트 데이터 파싱
(준비중)
Akka Actor
툴킷으로 JVM상의 동시성과 분산 어플리케이션을 단순화 하는 용도
Actor Model
Actor model은 아래와 같은 개념을 가진다.
- 첫째, 다른 액터에 한정된 개수의 메시지를 보낼 수 있다. (Send a finite number of messages to other actors.)
- 둘째, 유한한 개수의 액터를 만들어낼 수 있다. (Create a finite number of new actors.)
- 셋째, 다른 액터가 받을 메시지에 수반될 행동을 지정할 수 있다. (Designate the behavior to be used for the next message it receives.)
- 마지막으로, 이러한 모든 일이 동시적으로 일어난다.
Actor는 서로간에 공유하는 자원이 없고 서로간의 상태를 건드릴 수도 없다. 오직 message만을 이용해서 정보를 전달할 수 있다.
Actor model은 1973년 칼 휴이트가 제안한 수학적 모델을 기초로 삼고 있다. 이러한 오래된 개념이 다시 관심을 받게 된 이유는 multi processing에 적합한 개념이기 때문이다. multi-core 환경을 효율적으로 활용하기 위해 여러 개의 thread를 사용하여 구현하는 것이 중요해졌다. 하지만 thread 간에 가지는 공유된 자원으로 인해 race condition, deadlock, blocking call 등의 문제가 발생하기 쉽다. 이를 회피하기 위한 방법의 하나로 actor model을 구현한 Akka가 등장했다.
**Akka의 특징**
- 처리율(throughput): 암달의 법칙에서 설명하는 순차적 부분이 차지하는 면적을 최소한으로 줄이면서 프로그램의 전체적인 처리율은 그와 반비례해서 급등한다.
- Scale Out: Scale out을 구성파일의 내용을 약간 수정함으로써 자동으로 보장해준다.
- 모듈화(modularity): Akka를 이용하면 클래스나 객체를 중심으로 설계를 하던 방식이 "Actor"를 중심으로 바뀐다. Actor는 서로 완벽하게 독립적이며, 메세지를 주고 받는 방식으로만 통신하므로 코드의 응집성(coherence), loosely coupled, 캡슐화(encapsulation)가 보장된다.
'📘 Frontend > Vue' 카테고리의 다른 글
| Vue - Local Test시 Cross Origin Proxy 우회하기 (0) | 2023.08.15 |
|---|---|
| Vue 3 Composition API : Vuex - Actions (Asynchronous) (1) | 2023.08.13 |
| Vue 3 Composition API : Vuex Basic & Mutation (0) | 2023.08.13 |
| Vue 3 Composition API : Script Setup & LifeCycle Hooks (0) | 2023.08.10 |
| Vue 3 Composition API : Methods & Computed & Watcher (0) | 2023.08.10 |